Algotrading's Black Thursday: How We Lost 40% of Accumulated Profit in One Day—and What We Changed
This is a transparent post-mortem of our Phantom Paper and NEXUS Testnet for May 6, 2026. We're building algorithmic trading bots in public—which means we also analyze our drawdowns in the open. Inside: the PnL chart, the causes of the failure, what we fixed, and why this day was more valuable than ten winning ones.
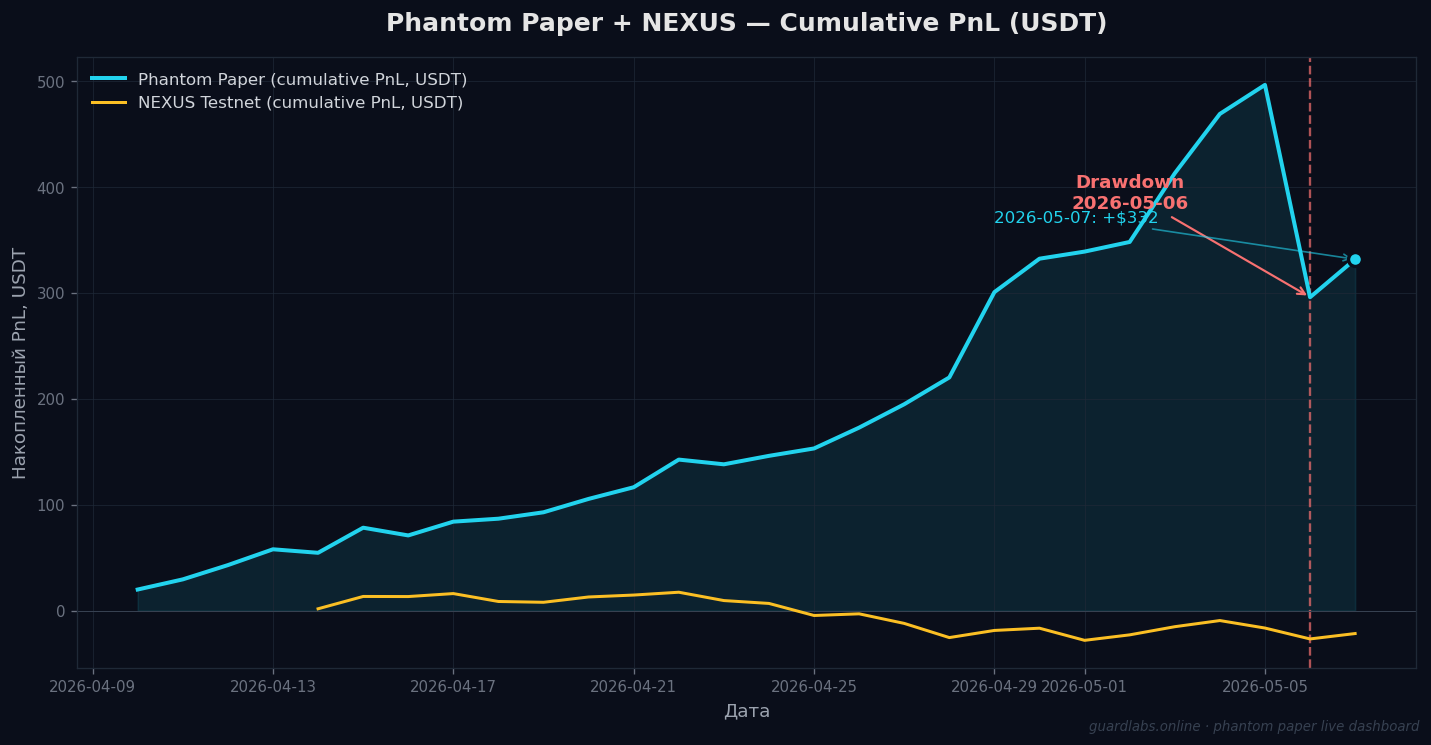
Phantom Paper (cyan) and NEXUS Testnet (yellow), cumulative PnL by day since April 10, 2026. The red dotted line marks May 6, the day of the incident.
What Happened—The Unvarnished Truth
Phantom Paper is our paper-trading algorithmic bot, where we publicly refine our methodology for building trading infrastructure. The dashboard is embedded directly on the nexus-bot.pro landing page and updates in real-time—anyone can see the PnL, win rate, and open positions right now.
As of May 5, the accumulated PnL for Phantom stood at +$496.35 with 36 trades for the day and a win rate of 17 of 36 (47%). The cumulative chart had been climbing steadily since April 10—nearly a month of normal growth.
On the morning of May 7, we opened the dashboard and saw the number: +$295.89.
In a single day, May 6, the bot gave back −$200.46. The win rate for that day was 9 of 40 (22.5%). This isn't noise—it's a system that entered a market regime it wasn't calibrated for and didn't know when to stop. NEXUS Testnet, our second bot running on a smaller volume, was also affected: −$10.29 with a win rate of 7 of 22 (32%)—milder, but trending in the same direction.
A 40% drawdown of accumulated profit in one day is serious. And it's a serious signal that the system has a blind spot.
Why We're Writing About This Instead of Pretending It Didn't Happen
The public discourse around algotrading is shrouded in smoke and mirrors. Everyone only shows up-and-to-the-right charts, screenshots of "+12% in an hour" trades, and case studies with a 70%+ win rate over a month without a single drawdown. This is either a very short time frame, cherry-picking from a dozen similar bots, or simply a fabricated image.
We are building an educational project, nexus-bot.pro. When you teach people to build trading infrastructure, the only honest strategy is to show real numbers. And real drawdowns. Otherwise, you're not selling a methodology; you're selling a lottery ticket.
That's why we keep the Phantom Paper Live Dashboard public, with all its volatility. And that's why today's post isn't an "oops, everything's fine, nothing to see here," but a full incident analysis.
Anatomy of the Incident—What Technically Happened
The market on May 6 opened in a regime that the strategy interpreted as a continuation of the upward movement that began on May 4. Setups appeared on lower timeframes that had generated consistent profits in previous days: the indicator landscape pointed to a reversal upward after a brief pullback.
However, that same morning, a break of structure occurred on the higher timeframe—what was previously support became resistance. The price began making sharp downward impulses, after which it looked ready for reversal setups on the lower timeframes. But these "reversals" turned out to be mere pauses within the broader downward move.
The strategy opened long positions on these "false" upward reversals, the price continued down, and the positions were closed at their protective stop-loss levels. After 30-90 minutes, a new "reversal up" signal would appear, and the cycle would repeat. This is how we accumulated 31 losing trades against 9 winning ones over the day.
This is a classic regime that algorithmic traders call a "trend breakout trap" or fade-the-fade: the market looks like a series of reversals, but on a higher horizon, it is moving linearly in one direction, and each "correction" is just a staging ground for the next impulse.
Our system had a lower-timeframe context—we look at what's happening in the moment on a short window. It also had a higher-timeframe context—the direction and character of the move on larger windows. But the link between them—the logic that should have said, "don't open a reversal setup if the higher timeframe is continuing to move with acceleration in the opposite direction"—was not strict enough.
To put it simply: the bot saw the trees but missed the burning forest.
What We Weren't Doing (and What Became Obvious in Hindsight)
- We weren't tracking changes in the HTF's market character in real-time. We have a metric that distinguishes between "trending" and "ranging" modes, but it reacts to regime changes with a delay. On May 6, that delay cost us three hours of bad entries.
- There was no automatic circuit breaker for a series of consecutive losing trades on a single instrument. We could have paused after the third or fourth loss on BTC, analyzed the situation, and then continued. Instead, the bot kept trading the same instrument with the same rules.
- There was no daily loss limit. When the daily loss exceeded a certain fraction of the accumulated profit, no protective pause was triggered. The strategy continued to hunt for entries.
All three of these points are standard elements of disciplined risk management, written on the first page of textbooks. But there's a chasm between "knowing you need a daily limit" and "implementing one that actually triggers on the exact drawdown it's supposed to." We crossed that chasm through a real incident.
What We Changed
Without disclosing specific parameters (this is part of our IP, which we sell through our educational program—where we detail how to calibrate each of these limits for your instrument, capital, and style), here are the changes in general terms:
- Strengthened the link between lower and higher timeframe context. The strategy will no longer open a reversal setup on a lower timeframe if a persistent trend is confirmed in the opposite direction on the higher timeframe and that trend has not yet shown signs of exhaustion.
- Added a consecutive loss circuit breaker per instrument. After a specific sequence of losing trades on a single symbol, the bot pauses trading on that symbol for a predetermined period. This prevents "sticking" to a single bad context.
- Implemented a daily protective loss limit. When the total daily PnL crosses a predefined threshold, all trading is halted until the next day. This isn't just "stop opening new positions"—it's a complete pause to prevent any attempts to "win it back."
- Expanded our incident logging. We were already logging every decision to the database, but we've now added special markers for anomalous series. This will reduce the post-mortem time for the next incident from a two-hour manual SQLite query to a five-minute review of a pre-built report.
The Result—May 7
We deployed the fixes on the morning of May 7 and watched how the bot performed in the first few hours. As of this writing, Phantom has closed 24 trades with a win rate of 16 of 24 (67%) and a daily PnL of +$35.88. NEXUS has had 3 trades, all profitable. This doesn't mean "everything is fixed"—it means "one day of normal operation." One day doesn't prove anything; we need to live through at least 2-3 different market regimes to be sure.
But the direction is correct. Phantom's cumulative PnL has returned to +$331.77 (at the time of publication) and is growing again.
What This Means for Those Learning from Us
The main lesson from this incident is not "we had a bug, and we fixed it." That's trivial. The main lesson is this:
Any algorithmic strategy is a set of hypotheses about how the market works. Every drawdown is the market telling you, "This hypothesis of yours was incomplete." A good algo-system developer isn't one who has no drawdowns. It's one who, after a drawdown, doesn't try to magically tweak parameters but calmly conducts a post-mortem, adds a protective mechanism, and moves on.
In our educational course at nexus-bot.pro, we teach precisely this engineering discipline: how to structure a strategy, how to test it on historical data without overfitting, how to build protective layers, how to conduct post-mortems, and how to iteratively improve the system without breaking it. This is an engineering approach to trading, not a "signal sheet."
And we keep Phantom Paper open precisely so you can verify that we're not showing you pretty, fabricated case studies; we're showing you a live system with all its pains and victories.
What We DO NOT Do
To be perfectly transparent:
- We do not sell the ready-made strategy code. Ever. It's our primary asset, and we use it ourselves. What we sell is the methodology, the infrastructure, and the opportunity to learn from an engineer who is actually building and maintaining a working system.
- We do not provide signals. We do not manage other people's money. We do not promise "X% returns per month." If our strategy could guarantee such returns, we'd be trading it with our full deposit, not teaching others.
- We do not only show our wins. This article is the best proof of that.
If You Want to Follow Along
The real-time Phantom Paper dashboard is at nexus-bot.pro. Open positions, trade history, cumulative PnL—it's all on one page, no registration, no email capture.
The full curriculum for our course on building your own trading infrastructure is also on nexus-bot.pro, in the pricing section. It covers architecture, risk management, backtesting, meta-filtering, and post-mortem protocols (the very protocols that saved us yesterday).
If anything is unclear or you'd like a technical discussion, email us at audit@guardlabs.online. We are engineers; we answer engineering questions.
P.S. This article is, in itself, an example of how we approach our work. We have a rule: every incident must be documented transparently so that we can learn from it, not pretend it never happened. We apply this rule to our infrastructure, our bots, and our communication with you.
Learn to build algorithmic infra in the open
On nexus-bot.pro we openly walk through the methodology of building trading bots — architecture, risk management, backtesting, post-mortems. Phantom Paper Live Dashboard always open for verification.